

We helped a leading manufacturer in implementing data-driven strategies for capital management, enhancing their operational efficiency

The Results
Better cash monitoring with expedited account receivable u0026 payable plan
Better supplier u0026 customer relations with focus on timely payments u0026 invoice settlement monitoring
Automated report refresh.
The Challenge
The client is a leading chemical manufacturer with a strong presence across Asia and international markets. Effective capital management is critical to supporting the company’s long-term growth and profitability, and it has consistently maintained a healthy cash surplus ranging from $6 million to $10 million.
However, changing market conditions created the need for a more strategic approach to capital allocation, budgeting, and financial planning. The client required greater visibility into financial performance to make faster, data-driven investment decisions.
To address these challenges, ADA implemented a Business Intelligence (BI) dashboard that provided real-time insights into capital management and financial planning. The solution enabled more informed decision-making, improved budget forecasting, and strengthened the client’s ability to manage capital efficiently while supporting its growth ambitions.
The Solution
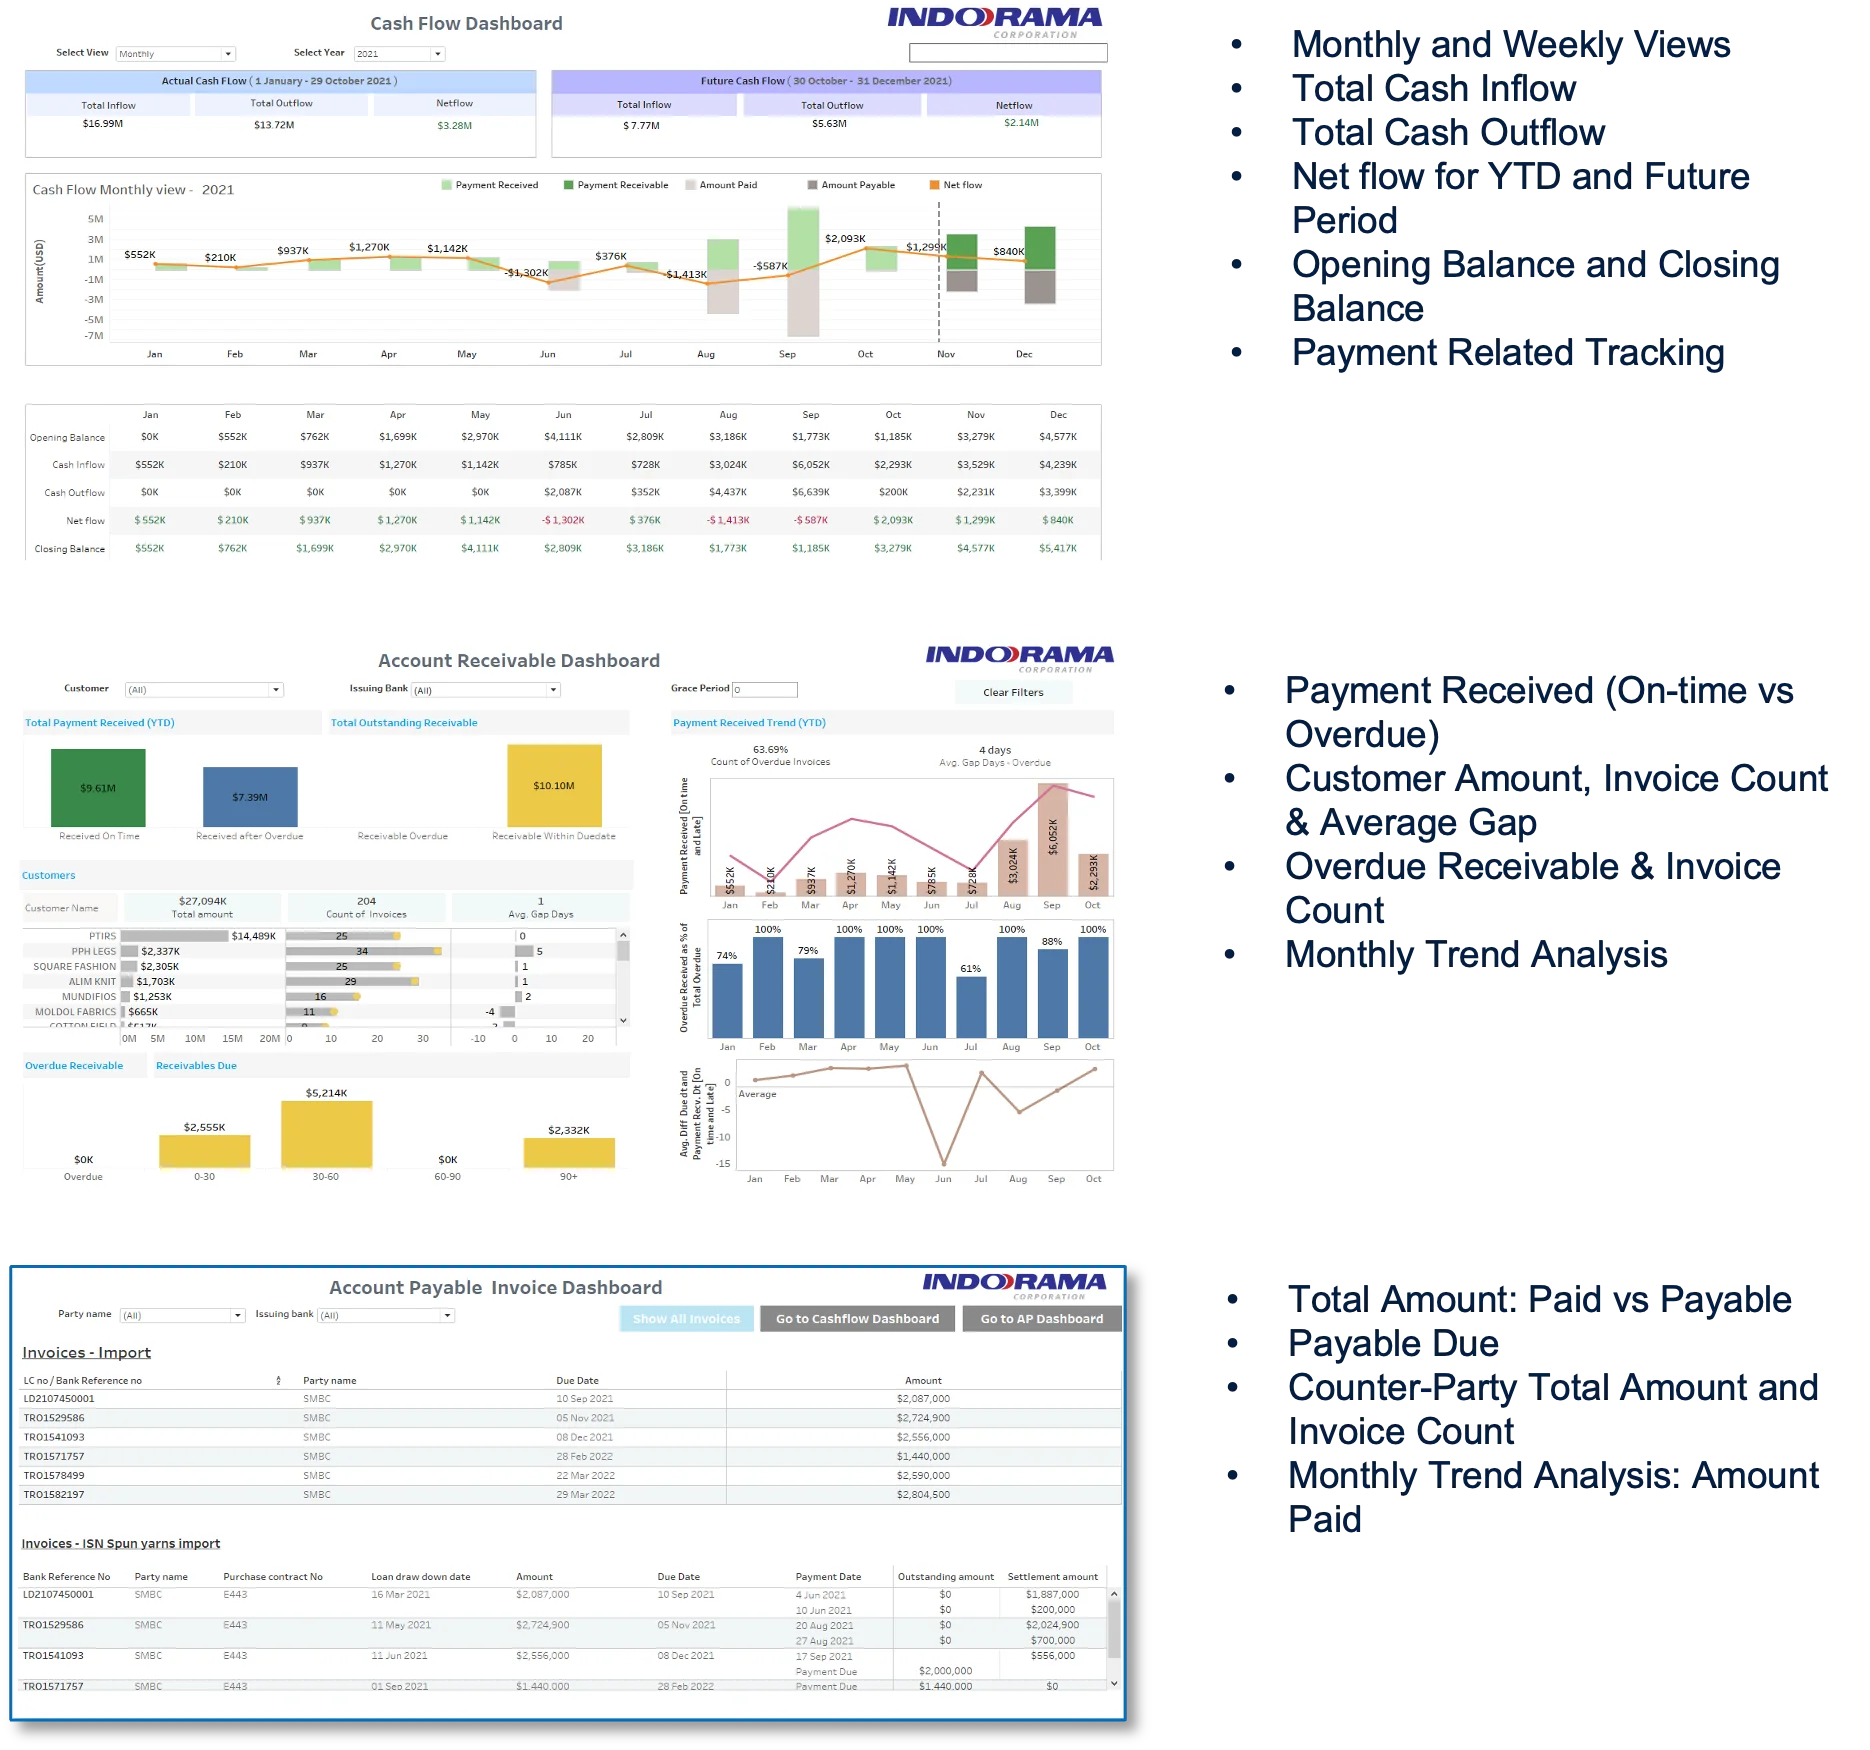
ADA developed a Business Intelligence (BI) Dashboard that provides real-time visibility into cash flow and financial performance. The solution enables the organisation to optimise capital allocation, improve financial planning, and proactively manage financial risks through interactive analytics and reporting.
Cash Flow Dashboard
- Monitor cash inflows, outflows, and net cash flow across multiple time periods, including weekly, monthly, and year-to-date (YTD).
- Compare actual cash flow against projected future cash flow.
- View a detailed financial breakdown, including opening balance, closing balance, receivables, and other key cash flow metrics.
Accounts Receivable Dashboard
- Track receivables by on-time and overdue status.
- Monitor invoices and outstanding balances at the customer level.
- Analyse receivable trends to improve collections and cash flow forecasting.
Accounts Payable Dashboard
- Track payables by on-time and overdue status.
- Monitor invoices and outstanding amounts at the supplier or counterparty level.
- Analyse payment trends to support effective cash management.
Dashboard Visualisation Example
Explore More Resources on Personalized Marketing