We helped a multi-national electronics firm improve performance by enabling data-driven, automated decision making

Optimizing the performance of individual business units is a cornerstone of sustained success. Our client, a renowned Japanese multinational conglomerate, operates across diverse sectors, including photography, electronics, biotechnology, and chemicals.
However, confronted with the challenge of manual reporting processes, they sought a streamlined solution to automate analytics for headquarters (HQ) and regional HQs across their various business units.
To address this pressing need, our client embarked on the implementation of a Business Intelligence (BI) Dashboard. Through this initiative, our client aims to enhance efficiency and maintain its leadership across multiple industries.
We developed a Business Intelligence (BI) Dashboard – an automated tool that enables real-time analysis of financial performance, eliminating manual efforts and providing actionable insights
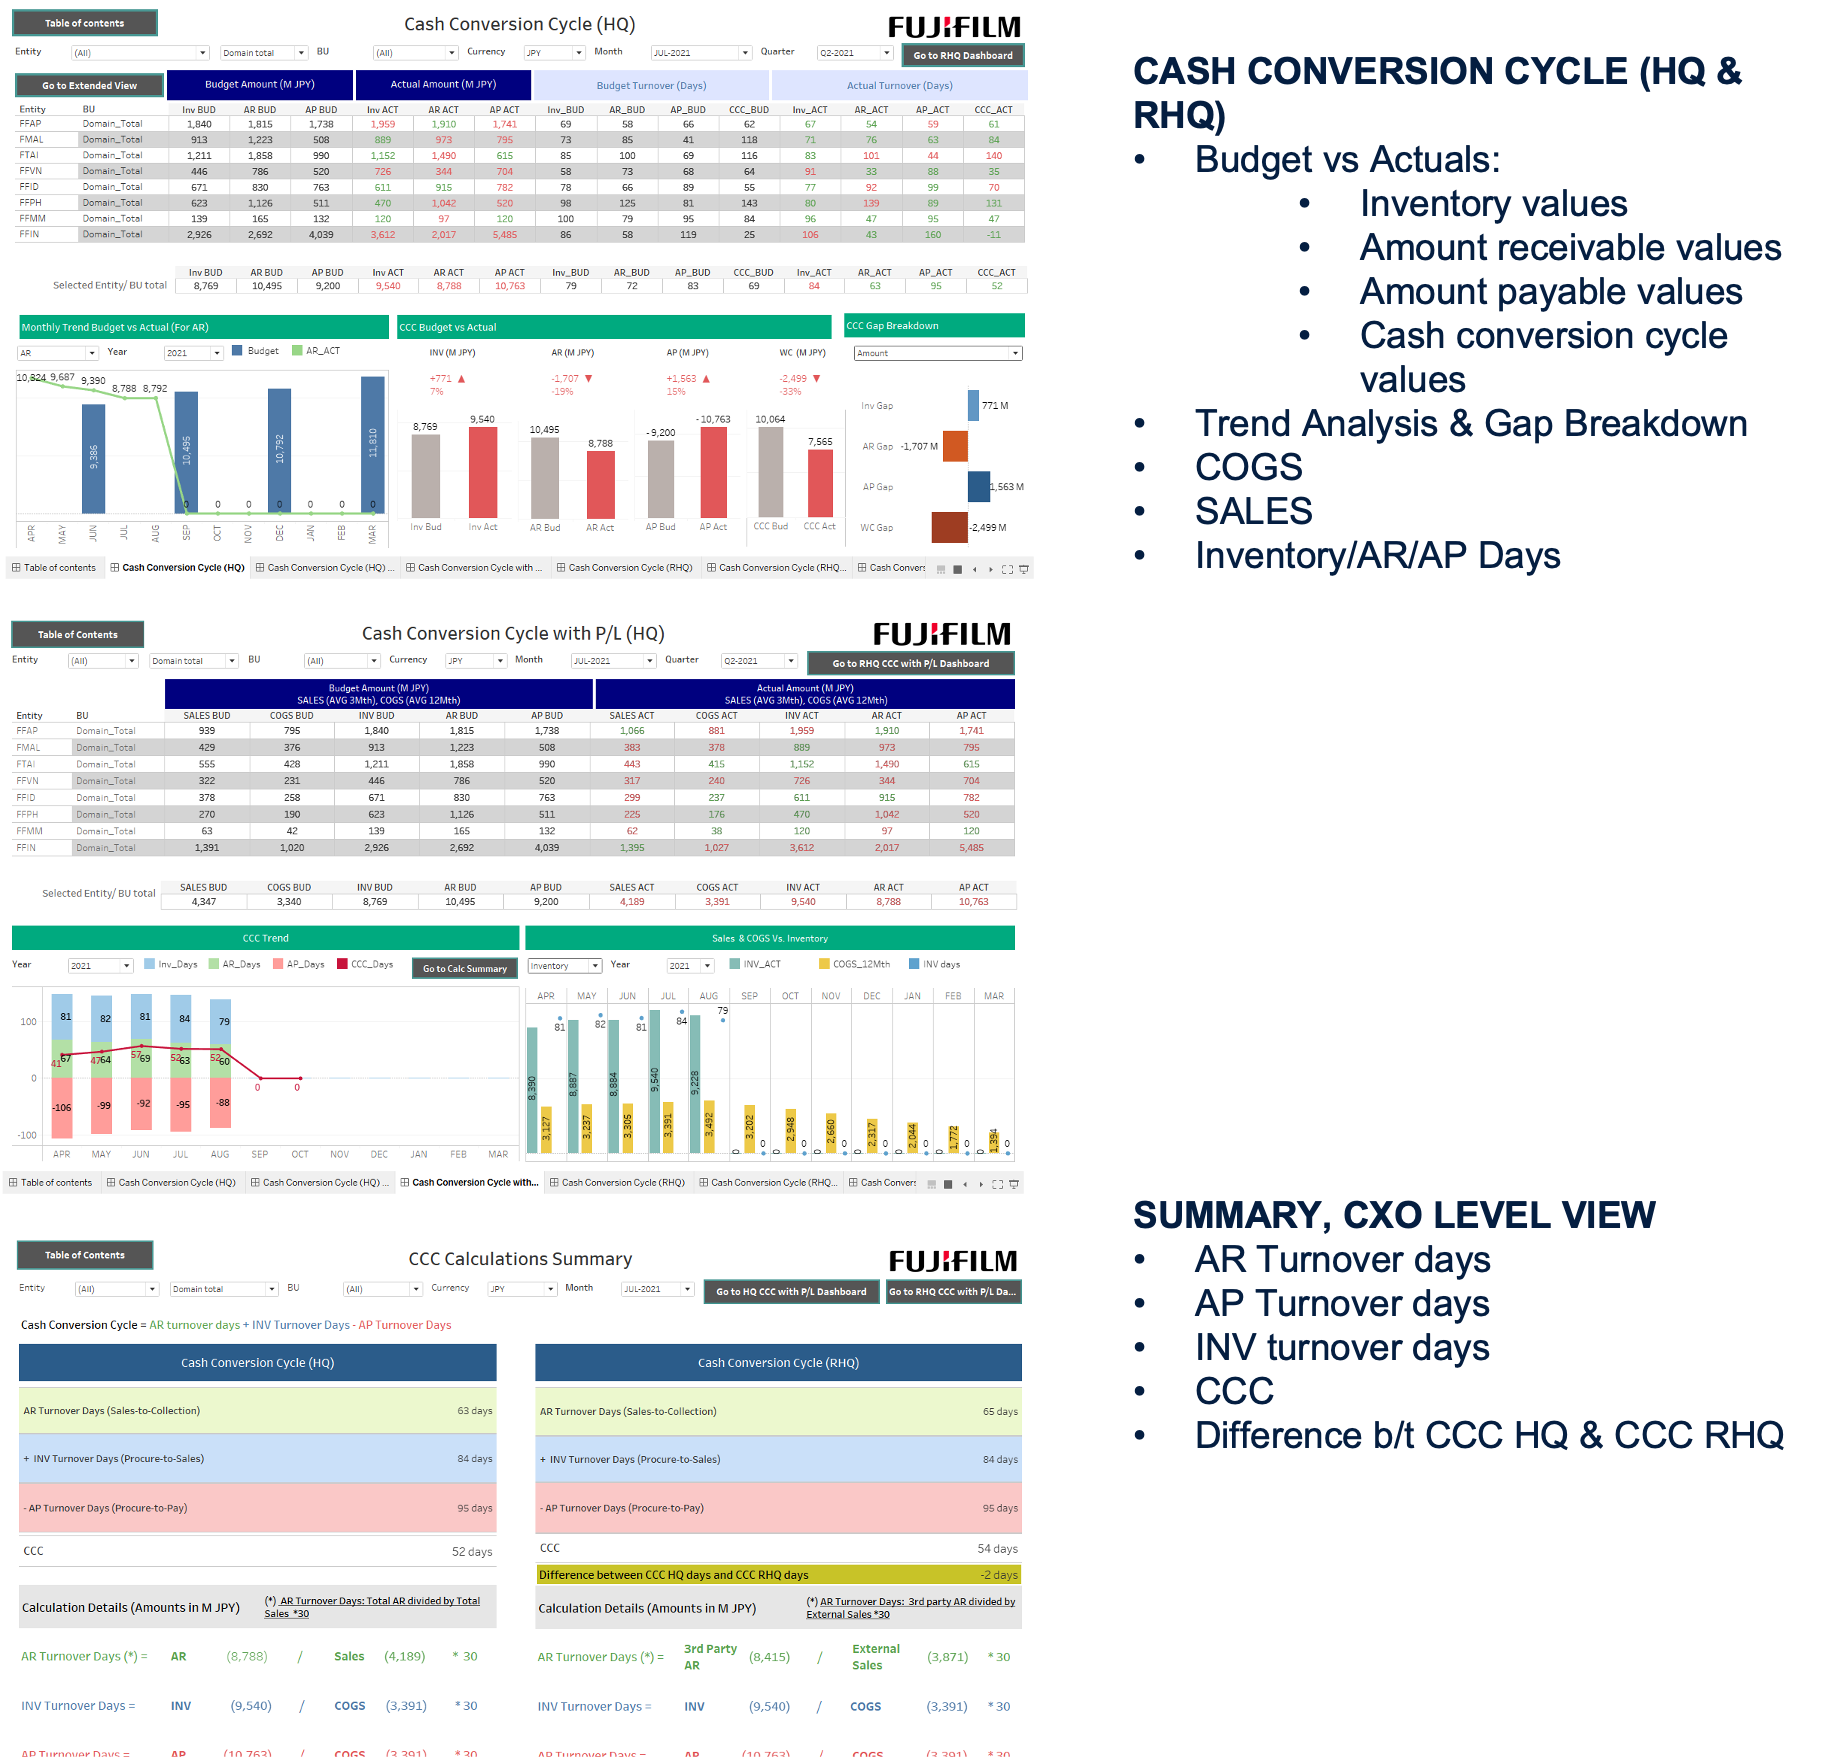
Cash Conversion Cycle
- Cash Conversion Cycle: Trend of Budget vs Actual
- Amount Receivable & Payable
- Inventory Trend
- Gap Analysis: Inventory, AR, AP, WC
Corporate Level View
- HQ vs Regional HQ Analysis
- COGS, Sales, & AR/AP Days
- Business Unit Level Analysis & Comparison
Planning
- AR, AP, & Inventory Turnover Days
- Cash Cycle Conversion Days
- Business Unit Level Analysis & Comparison
Dashboard Visualizations Examples